
Spare Parts
What does it mean to be genuinely, historically, exceptionally bad, and were the teams we remember as bad actually as bad as we think?

Ask any Formula 1 fan about the worst team they can remember and you will get a plethora of different responses. Some will say "Minardi was pretty bad there at the end." Others might point to Manor, Marussia, Virgin, or whatever other name they were calling themselves that particular season. Some disgruntled tifosi might even scream Ferrari after another undeniably wrong, if technically defensible, strategy call. All three answers might have a case.
The thing is, I don't remember any of those teams being particularly worse than any other bad team. Except Ferrari of course, they aren't actually bad at all. Every season has a team that struggles to get near the points, and every era has a team that always seems to be finishing a lap down. These teams were bad, certainly. But historically bad? So bad it's worthy of serious discussion?
I tried to find out. What followed was an analysis of qualifying times for every round of every season from 1995 through 2025, a thirty-year period I call the modern era of Formula 1. This era covers the sport's rapid professionalization in the late nineties, the cost explosion of the early two-thousands, and the grid stabilizing into something resembling its current form. The methodology I used is fairly straightforward in principle and is explained in full in the following section for those who want to understand how the numbers were produced. For those who trust the process, the short version is this: every team's qualifying pace is measured against the championship winning car of that season, and against the middle of the field. Those two measurements together tell a story that points and race results do not.
This article is not about just one bad team and one bad season, it is about what the data reveals when a consistent methodology is applied to thirty years of Formula 1 qualifying times and asks a simple question. What does it mean to be genuinely, historically, and exceptionally bad; and were the teams we remember actually as bad as we think? A few of the teams I mentioned above will show up in the data. Some I haven't mentioned yet will surprise you. Answering the question of who was worst is not as simple as pointing at a name on a grid and saying bingo. It requires an understanding of what worst means, how it is measured, and what the competitive landscape of any given season actually looked like beneath the surface of the championship table.
What it means to be "Worst"
What does it mean to be bad? What does it mean to be bad at being bad? It sounds like it would be straightforward. Look at the constructor’s championship, find the team at the bottom, and you have your answer. But all last-placed teams are not created equal.
In 2009, Toro Rosso finished last in the constructor’s championship. They managed to eke out 8 points. on the surface they look to be a normal last-placed team who scored 1 or two more points than would be typical. However, when looking at pure qualifying pace across each round for a full season, their average qualifying pace was 101.1% of the championship car pace. For context the average midfield car (5th place team in a 10-team field) would be 101.6% of the championship car pace. This means that in a typical season Toro Rosso would expect to finish within the Top 5! This means that Toro Rosso are not bad, rather one can conclude that the cars run by all the teams in that season were abnormally competitive.
The 2009 Toro Rosso demonstrates why championship points are a poor measure of car performance. A single mechanical failure, a strategic miscalculation, a crash, or simply an abnormal number of very competitive cars can cost a team points that their car was genuinely capable of earning. Reliability, strategy, and circumstance all contaminate the signal. Points contextualize a cars performance within a single season relative to the other cars within that season. They do not contextualize across season, or relative to absolute pace.
Championship points measure outcomes. They do not measure performance.
Fortunately, every weekend each team is required to send both of their cars out on track and set the fastest lap time they are capable of. This happens during qualifying and every driver is incentivized to post the fastest lap time with the best available tire. There are no pit stops, no fuel loads, little to no traffic managements, and very few strategic considerations other than "go fast". Therefore, the best lap time a team produces in qualifying is likely at or very near the peak output of the car and driver combination. A team that is slow in qualifying is slow because the car is slow.
In order to meaningfully compare qualifying pace across different circuits and different seasons, we need a consistent benchmark. And what better benchmark than the pinnacle of what the sport could produce in a single season, the Constructors Champion. From this benchmark I gathered the fastest qualifying time posted by any driver on the team, in any qualifying session, for each round of each season. Every other team’s qualifying time is then expressed for each round as a percentage of the champion benchmark. A result of 99% means they were 1% faster than the champion in qualifying (rare but did happen for a few midfield teams every few years), and as result of 105% means they were 5 % slower. The bigger the number the bigger the performance deficit.
Three tiers of teams are tracked across each season. The Constructors Champion provides the benchmark and is always 100% by definition. The midfield team is the constructor that finished at the mathematical midpoint of the Constructor’s Championship standings. The last place team is the constructor that finished bottom. Together these three tiers provide a picture of the competitive landscape from front to back.
| Year | Champion | Midfield | Last Placed |
|---|---|---|---|
| 1995 | Benetton | Ligier | Pacific Ford |
| 1996 | Williams | Jordan | Minardi |
| 1997 | Williams | Jordan | Minardi |
| 1998 | McLaren | Benetton | Tyrrell |
| 1999 | Ferrari | Williams | Minardi |
| 2000 | Ferrari | BAR | Prost |
| 2001 | Ferrari | Jordan | Minardi |
| 2002 | Ferrari | Sauber | Toyota |
| 2003 | Ferrari | BAR | Minardi |
| 2004 | Ferrari | McLaren | Minardi |
| 2005 | Renault | Williams | Minardi |
| 2006 | Renault | BMW Sauber | Super Aguri |
| 2007 | Ferrari | Red Bull | Spyker |
| 2008 | Ferrari | Toyota | Force India |
| 2009 | Brawn GP | Toyota | Toro Rosso |
| 2010 | Red Bull | Williams | Lotus, Virgin, HRT |
| 2011 | Red Bull | Force India | Lotus, Virgin, HRT |
| 2012 | Red Bull | Sauber | Caterham, Marussia, HRT |
| 2013 | Red Bull | Force India | Marussia, Caterham |
| 2014 | Mercedes | Force India | Sauber, Caterham |
| 2015 | Mercedes | Force India | Marussia |
| 2016 | Mercedes | McLaren | Sauber, Manor |
| 2017 | Mercedes | Williams | Sauber |
| 2018 | Mercedes | Haas | Williams |
| 2019 | Mercedes | Renault | Williams |
| 2020 | Mercedes | Renault | Williams |
| 2021 | Red Bull | Alpine | Haas |
| 2022 | Red Bull | McLaren | Williams |
| 2023 | Red Bull | Aston Martin | Haas |
| 2024 | McLaren | Aston Martin | Sauber |
| 2025 | McLaren | Williams | Alpine |
Teams that did not enter and start every round of the calendar are excluded from that season entirely. A team that misses races due to financial distress or organizational collapse is not primarily a story about car performance; it is a story about survival.
The 2014 season illustrates this; Caterham and Marussia both missed rounds that year, and Marussia lost Jules Bianchi at the Japanese Grand Prix in circumstances that transcend any analytical framework. The last place representative for 2014 is therefore Sauber; a team that finished above two other zero-points constructors in the standings, whose qualifying data shows a broadly competent car devastated by the reliability crisis affecting non-Mercedes power units. This is the methodology working correctly rather than producing an anomaly.
Weather conditions are handled similarly. Where conditions varied across qualifying sessions, only times from the consistent-condition session are used. A missing data point is methodologically cleaner than a corrupted one.
The most consequential methodological decision in this analysis concerns what worst actually means, and it requires two measurements rather than one.
The first is gap to the championship winning car. This tells us how far from the front of the grid a team sits. But it cannot distinguish between a team that is slow and a team that is slow because the car at the front is historically fast. A large gap to the champion could mean the back-marker is terrible. It could equally mean the champion is exceptional.
The second is gap to the midfield. The constructor at the mathematical midpoint of the standings represents what a normally funded, competently run Formula 1 team achieves in that season. In a typical 10 team season, this would be the 5th place finisher in the Constructors Championship. They are the baseline of normal competition. The gap between a back marker and that midfield baseline measures how far a team sits below the competitive floor of their era, independent of what is happening at the front.
These two measurements become fully meaningful only when read together. A team with a large gap to the champion but a small gap to the midfield is competing in a season where the field is compressed behind an unusually dominant car. Conversely, a team with a large gap to both the champion and the midfield is a team whose deficit belongs to them — not to the car at the front.
The worst teams in modern Formula 1 are not simply the ones furthest from the front. They are the ones furthest from where a Formula 1 car should reasonably be.
A third measurement completes the framework. Formula 1 has at various points enforced a 107% rule, a regulation requiring that every car must have set a qualifying time within 107% of the fastest time in the session. The threshold it defines is useful regardless of whether the stewards applied it on any given weekend.
The version used here differs from the regulatory application in one important respect. The regulatory rule has traditionally been applied against the fastest Q1 time. This analysis applies the threshold against the fastest time set by any car in the session that determines grid postion, in a modern knockout format this would be Q3.
In Q1, front running teams are not revealing their true performance. They are managing tire life, conserving power unit modes, protecting their cars for Q2 and Q3. The fastest Q1 time systematically understates what the leading cars are genuinely capable of. Back markers, by contrast, are incentivized to extract every tenth available — Q1 is their entire qualifying session. Measuring a back marker’s time against a managed Q1 effort produces a flattering comparison that obscures the true performance gap.
The metric is expressed as a percentage of entries failing to reach 107% of the fastest qualifying time recorded that weekend, calculated per car per round across the full season. This normalization is essential. The metric also reveals something about organizational resource allocation that pace averages obscure; when one driver consistently clears the threshold while their teammate consistently fails it, the per-entry distribution tells a story of organizational priorities that the team average cannot.
The framework as described is not attempting to tell us why a team is bad. But rather it establishes, with some precision, how bad they are.
1995 Pacific
Before the modern Formula 1 era can be examined on its own terms, it needs a boundary marker. A reference point that establishes what the sport looked like immediately before the period this analysis covers, and why that period represents a meaningful dividing line rather than an arbitrary one.
The 1995 season was the last year of a Formula 1 that still accommodated a type of team the sport no longer has room for, the gentleman racer, the privateer constructor. These teams, operating on minimal resources, with modest ambitions and genuine passion for the sport as its primary organizational asset made up much of the grid for a large percentage of the history of the sport. Pacific Ford were one of those teams, but there is an argument to be made that they were the last one.
Pacific Ford in 1995 posted a seasonal average of 107.4% of championship pace. Their 107% failure rate — calculated by the same methodology applied to every team in this analysis, against the fastest time set by any car across the entire qualifying session — was 88%. Nearly nine in every ten qualifying attempts by a Pacific Ford car failed to reach 107% of the fastest time set that weekend.
| Season | Gap to Champion | Gap to Midfield |
|---|---|---|
| 2003 Minardi | 104.34% | 104.27% |
| 2004 Minardi | 106.11% | 105.20% |
| 2005 Minardi | 105.20% | 104.14% |
| Dataset average | 104.1% | 102.66% |
Those numbers establish the pre-modern floor. They represent what a quasi-professional privateer team produced in a full competitive season before Formula 1 completed its transformation into a fully professional sport. But it is worth noting that Pacific Ford were not failing by the standards of their era. They were operating within the acceptable parameters of a Formula 1 that still had room for teams whose primary qualification was enthusiasm and whose budget reflected that. A team showing up, occasionally making the grid, and racing with whatever resources were available was a legitimate way to participate in Formula 1 in 1995. The professionalization that followed, the cost explosion, the technical arms race, the consolidation of the grid into fully funded constructor entries eliminated the conditions that had allowed Pacific Ford to exist. By the time the modern era this analysis covers was fully established, a team with their resources and ambitions could not have entered the sport at all.
Their numbers sit at the opening of this analysis not as a verdict on their organization but as a calibration of the sport they competed in. This is what the floor of Formula 1 performance looked like before the sport became what it is today. Everything that follows is measured against a sport that has moved considerably beyond that floor in everything from cost, to professionalism, technical sophistication, and in what is expected from every team that signs the entry form.
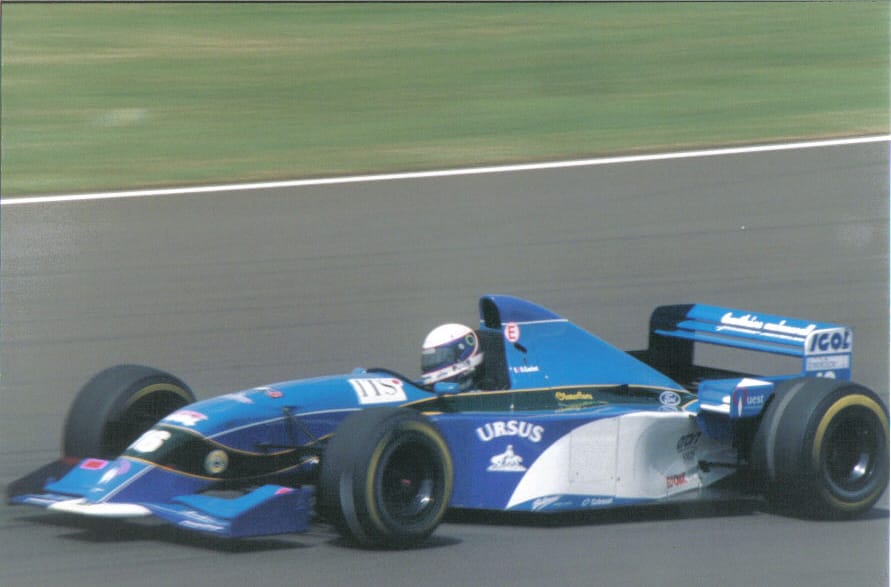
2003-2005 Minardi
Minardi are remembered with affection. In a sport that has always celebrated technical excellence and financial power, Minardi occupied a different space entirely; the underdog that kept showing up, the team that refused to quit, the constructors that gave opportunities to drivers who would go on to greatness while operating on budgets that their competitors spent on catering. Mark Webber, Fernando Alonso, Giancarlo Fisichella amongst others. Minardi's alumni list reads like a tribute to the talent their car could not showcase. They are romanticized in a way that few Formula 1 teams have been before or since, and that romance is not entirely without foundation.
Minardi's qualifying performance across the 2003, 2004, and 2005 seasons, the final three years of their existence before the team was acquired and reborn as Toro Rosso, shows their descent from a respectable back marker to firmly in historically bad territory for their final two seasons. Their seasonal averages across those three seasons were 104.34%, 106.1%, and 105.2% respectively. Against the cross-dataset average for last place constructors of 104.1%, Minardi in their final years were 0.34 points (2003), 2.11 points (2004), 1.1 points (2005) worse than the historical norm for the worst teams in the sport. 2004 Minardi in particular, at 106.1%, sits among the worst seasonal performances in the modern era dataset.
But not only were Minardi unable to compete with the best the sport could offer, they weren't close to the midfield either. During the same time frame the gap to the midfield sat at 104.27%, 105.2%, and 104.14%. Their normalized times to the midfield show a team that was farther from the midfield than a typical last-placed team would be from the front.
| Season | Gap to Champion | Gap to Midfield |
|---|---|---|
| 2003 | 104.34% | 104.27% |
| 2004 | 106.11% | 105.20% |
| 2005 | 105.20% | 104.14% |
| Dataset average | 104.1% | 102.66% |
Understanding why requires understanding what Minardi actually were by the early 2000s. They were not a failed modern constructor. They were the last survivor of a type of team that Formula 1 had been systematically eliminating for a decade. Founded in 1985, they had competed continuously for twenty years on budgets that their competitors would consider a rounding error. In the mid-1980s their budget and engineering talents could produce a capable midfield car. By the mid 90's their budget hadn't fundamentally changed, but the financial demands of the sport had meant that they were fighting to remain on the grid. As the team entered the new millennium ownership changed hands, but the technological pace of the sport had become so great that the team could not continue.
In spite of the qualifying pace woes this was a team that had true engineering talent, and race-craft. Between 2003 & 2005, despite running a car that for all intents and purposes was slower than what the typical last-placed team would run, Minardi scored points in an era when scoring points was limited to the top 8 finishing positions. They scored 1 point on merit in 2004, and yes, they scored 7 at the USA GP in 2005 but they were one of 3 teams to run cars amidst the Michelin/Bridgestone chaos at that GP. Of the 6 entries in that race, they finished 5th and 6th.
In spite of this, there is no other team with their relative performance deficit that was able to score points. Ultimately what contextualizes Minardi as a team that simply lacked funds rather than one that structurally did not belong in F1 is what happened after they were bought out and rebranded as Toro Rosso. That same team with a real, albeit modest, F1 budget is able to be one of the most consistent midfield teams of the last 20 years. This same organization, with Sebastian Vettel driving, were even able to famously win a race at Monza in 2008, just 3 years after this run. Further proving this point in 2009, Toro Rosso finished in last place with a normalized pace to the championship car at 101.07%. Not only is this the fastest last-placed car in this dataset, but also faster than the average midfield team in this data (101.4% of champion's pace). More importantly, since 2009 Toro Rosso has never finished in last place, and has never failed to score a point in a season.
Ultimately when looking at the first ten years of this data, Minardi are a frequent visitor in the last place slot. They finished last in 1996, 1997, 1999, 2001, 2003, 2004, & 2005. But in all but the last 2 years they were as fast or faster than would be typical for the last-placed team in this data set. To me, this paints the picture of a team that did more with less than anyone should reasonably expect, until the crushing financial realities of F1 made the wheels fall off (in spite of this Minardi still knew how to put the wheels on).
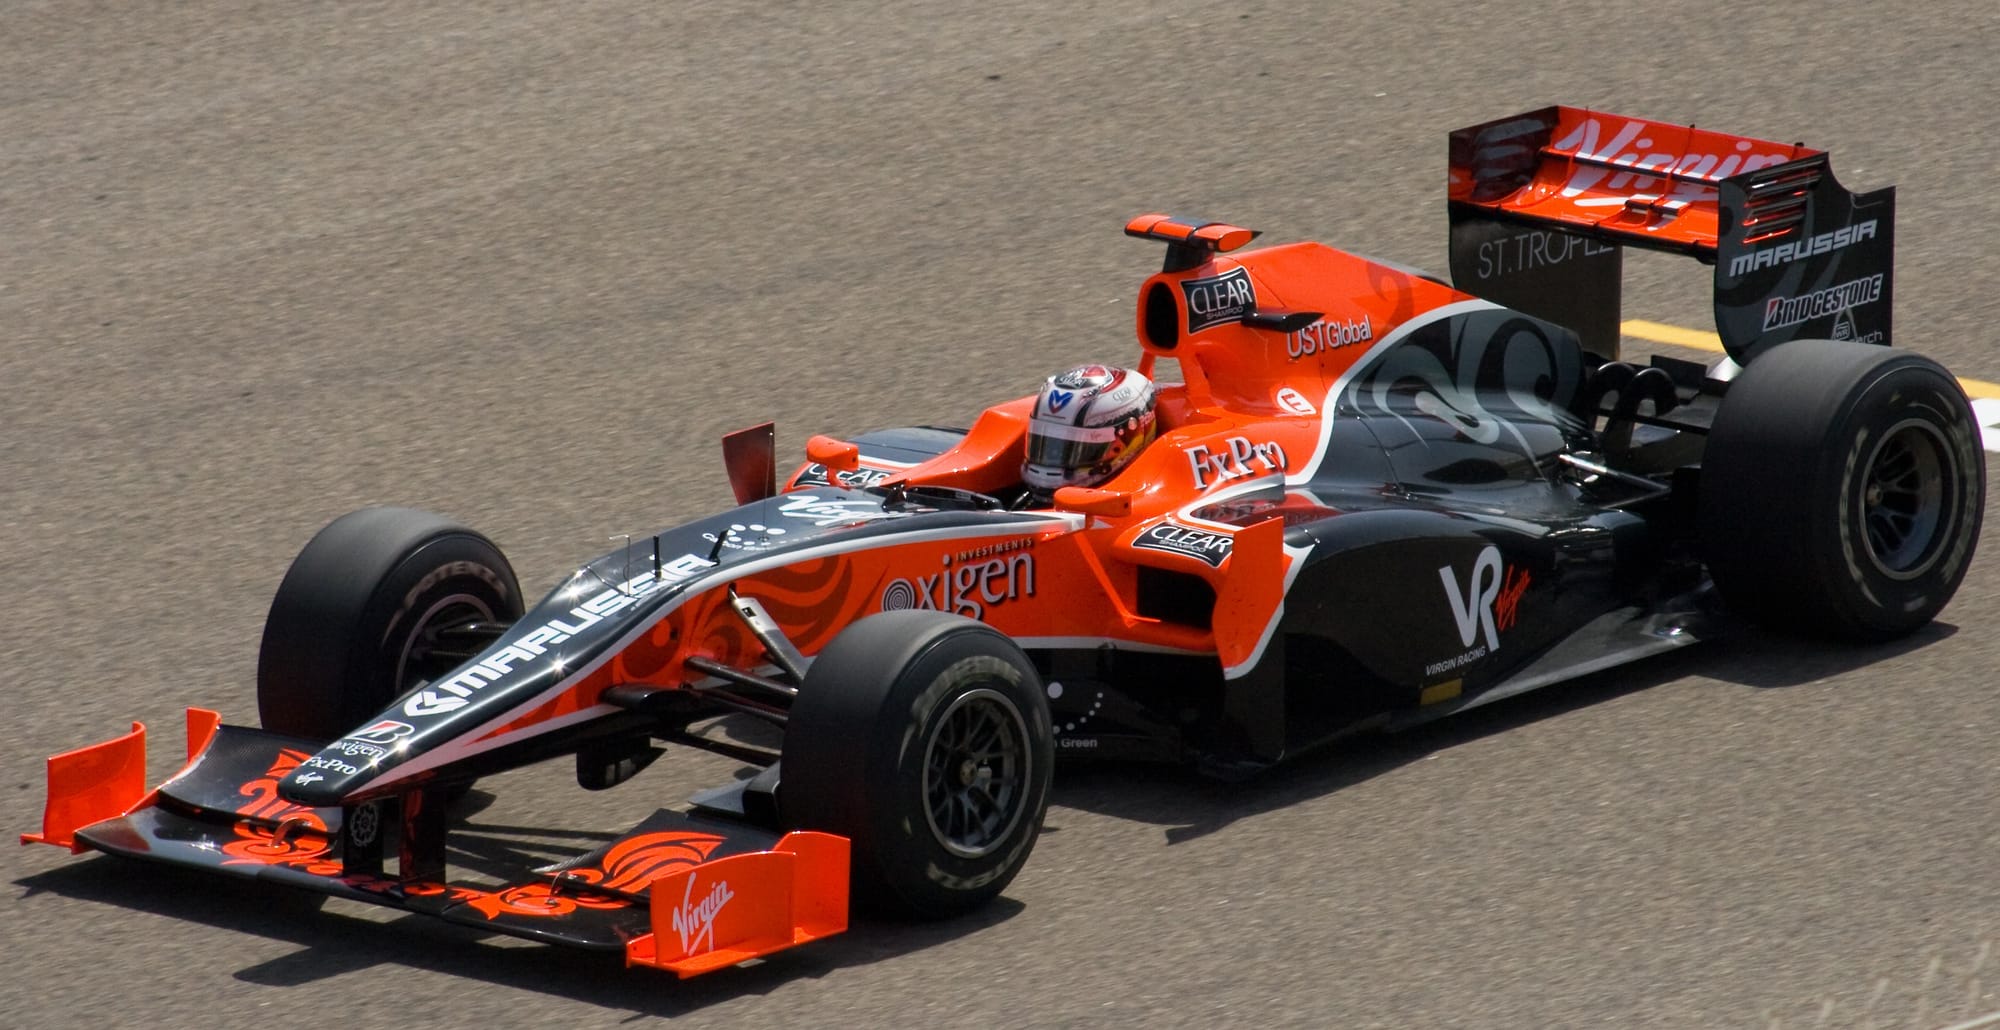
2015 Manor Marussia
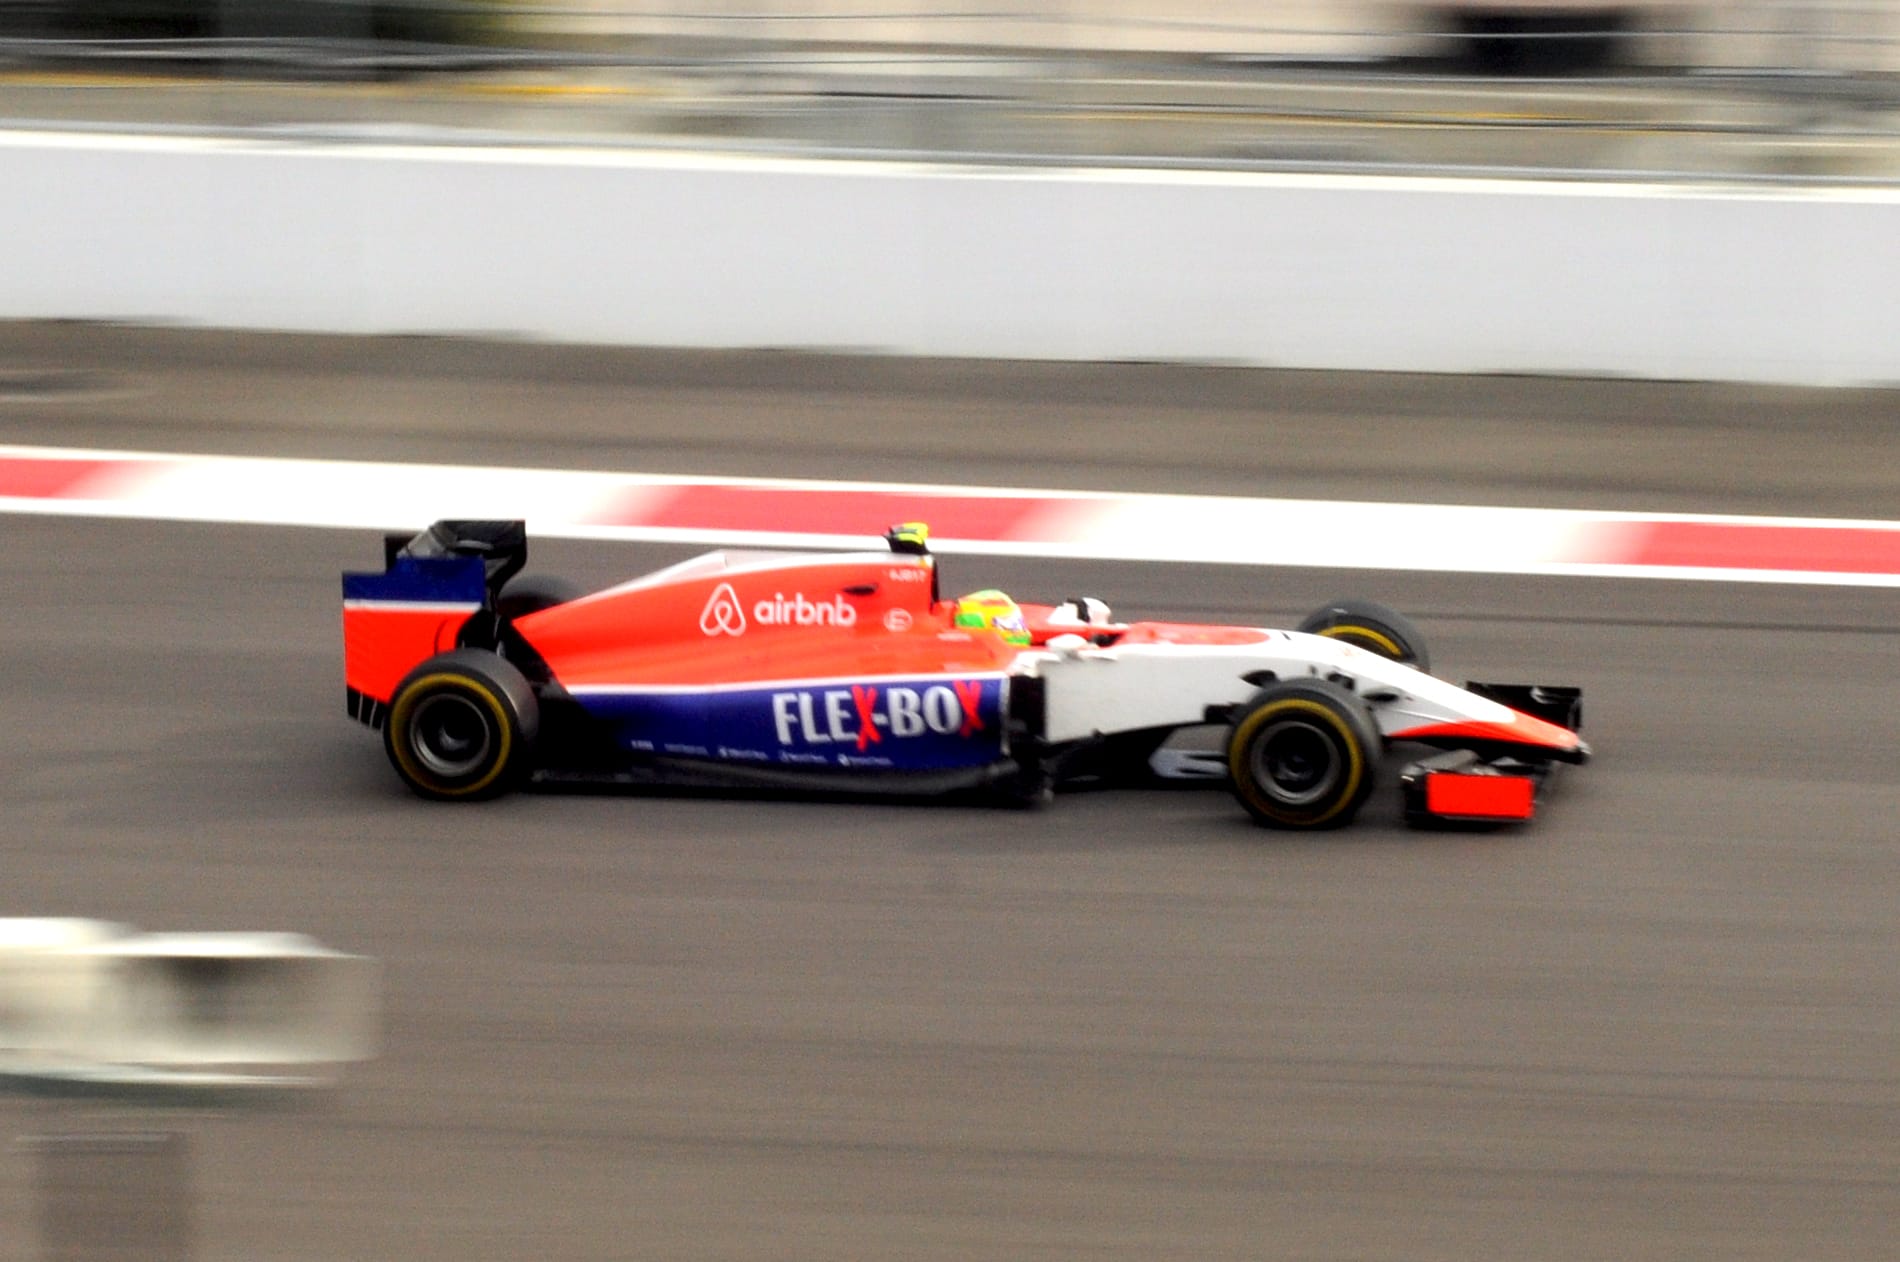
The 2015 season for Manor Marussia was defined far more by their October 2014 administration. Marussia had its assets sold in December 2014. The team's Banbury base was sold to Gene Haas, and ultimately became the UK base for Haas F1 when they entered the sport in 2016. During the winter, the team had a dramatic change in fortune and in February of 2015 Manor Marussia Motorsport announced their intention to enter the 2015 F1 season. However, in addition to losing their UK base, Gene Haas had also bought all of their technical data and designs for a 2015 car. This meant that Manor Marussia was going to be entering the 2015 season with a modified version of their unsuccessful (and only not eligible for discussion because it did not compete in the full season) 2014 chassis with modification to meet the 2015 regs.
When Manor Marussia made their triumphant return to the grid their 2015 seasonal average was 106.5% of championship pace. Against the cross-dataset average for last place constructors of 104.1%, that placed them 2.4 percentage points above the historical norm for the worst teams in the sport. Not only were they nowhere near the front of the grid, they were nowhere near any other car on the grid. They were 104.6% from the midfield team in 2015 as well. Even more damning, they failed to meet our 107% pace rule a whopping 39% of the time. They failed to field even a remotely competitive time 2 in every 5 times they went racing.
| Metric | 2015 Manor Marussia | Dataset Average |
|---|---|---|
| Gap to Champion | 106.50% | 104.1% |
| Gap to Midfield | 104.60% | 102.66% |
| 107% Failure Rate | 39% |
What separates Manor Marussia in 2015 from the teams that we will discuss later, is that their goal was to survive 2015 and make it to 2016. For a typical team fielding a car with a seasonal pace average of 106.5% would mean a complete shakeup for their technical department. For a team that had sold their headquarters, the first version of their 2015 car, and all of their technical data, just making the grid was a resounding success. But this context would only offer a real understanding if Manor Marussia had been anything other than historically bad for most of their existence in F1. They entered the sport in 2010 as Virgin Racing, changed the name to Marussia in 2012, and finally to Manor in 2015. In those 6 seasons, they appeared in this data set 5 times. The only time they did not appear is in 2014 when they did not complete a full season. This is a team that was not created by the chaos, but rather one that could no longer hide.
It was not until 2016, when Haas entered F1, that we understood what the technical data and chassis from Manor Marussia may have actually been worth. Haas F1 entered with a fundamentally new approach to F1, they bought every homologated component that the rules allowed them to directly from Ferrari. Haas also had a new chassis built by their partner Dallara. We may never know how valuable that data and chassis that Gene Haas bought from a bankrupt team in 2014 actually was to their unparalleled success in their inaugural season. But it does raise an uncomfortable question. Why after 6 seasons in the sport was the technical and design data of a Formula 1 team so apparently useless that the team that acquired it decided on acquiring a chassis from elsewhere and bought every part imaginable from a works team? Haas looked at everything Manor Marussia had built across 6 seasons in Formula 1 and concluded it was worth less than a Ferrari parts catalogue.
The full story of this organization does not begin in 2015. It begins in 2010 when they along with two other brand new racing teams entered Formula 1.
The Class of 2010
The 2010 Formula 1 season was the last time multiple new constructors entered the sport simultaneously. The circumstances were specific. The FIA had spent the better part of two years navigating a political crisis, manufacturer teams threatening a breakaway series, budgets spiraling beyond what any independent operation could match, and a grid that had contracted to the point where the governing body needed new entrants as much as it wanted them. The response was a formal application process, a proposed cost cap designed to make independent construction viable for the first time in a decade, and an open invitation to anyone who believed they could run a Formula 1 team.
Fifteen candidates applied to Join the sport. In the FIAs own words “All of those entries underwent a stringent due diligence process to ensure that new teams have the required level of funding, resources, experience and technical expertise to compete at the highest level of motorsport." This evaluation resulted in Lotus Racing, Virgin Racing, and Hispania Racing Team being chosen by the FIA as the most ready to hit the grid as a respectable normal team. They arrived together to start the 2010 season, faced the same competitive landscape, operated under the same regulatory framework, and started from the same line.
Across their first three seasons on the grid, all three teams scored a combined zero championship points. By the conventional measure of Formula 1 performance, they were identical. By every other measure they were not.
Lotus Racing
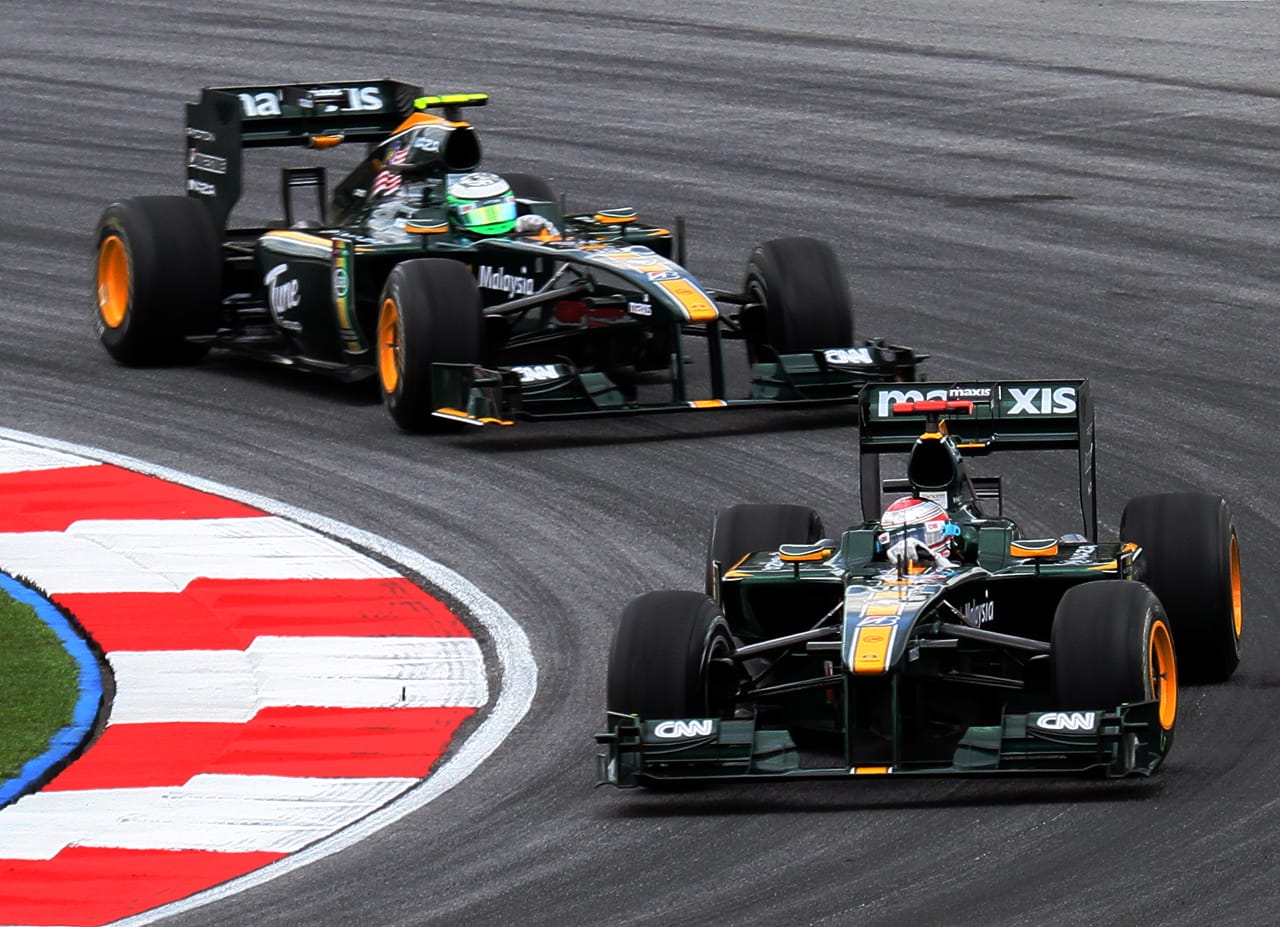
When the FIA officially announced Lotus in September 2009, they saw Litespeed F3 partnered with Malaysian entrepreneur Tony Fernandes who brought AirAsia logistics. They had Legitimate and respected junior formula racing experience, with Malaysian government backing, and a proven F1 logistics partner. On the 14th of September, the first four staff members entered an empty factory and started building a car that would race in Bahrain in 5 months. The factory in Hingham, Norfolk was, in Gascoyne's words, bare, empty and old. When Heikki Kovalainen visited for the first time, people were still building the walls and floors. Gascoyne phoned contacts he trusted, and by November they had a mock engine design. Technical director Gascoyne said they wanted to rival the debut of Brawn GP, then acknowledged the obvious: Brawn already had a car. The objective, stated plainly, was to have something on the grid in Bahrain.
At the season opener in the deserts of Bahrain Heikki Kovalainen finished fifteenth. Despite being two laps down on race winner Alonso, they were classified, running, and the only driver from any of the three new teams who could say that. Fernandes tweeted: "What an amazing day. Lotus is back. Two cars finishing." One had retired with hydraulic failure and been classified on distance. He counted it anyway. Given what had happened in the previous five months, that was not an unreasonable position.
This was the only bright spot in their season, because Lotus Racing in 2010 were bad. Their seasonal average of 105.1% of championship pace placed them 1.0 percentage points above the cross-dataset average for last place constructors of 104.1%. Additionally, their pace when compared to the midfield showed a similar lack of performance. They were 103.91% of the mid-field car (102.66% average), this represents a total pace deficit of 1.3 points from the typical last-placed car. For context, the average last place team in the modern era is already the slowest constructor on the grid in any given season. Lotus was worse than that average in their debut year.
When examining their 2010 season on a round-by-round performance it shows a team tracking close to but consistently slower than the typical last-placed team. Lotus occasionally performed at a level better than that mark, but were never reliably better. Ultimately their first season in Formula 1 represented a struggling constructor doing approximately what a struggling Formula 1 constructor does, but doing it slightly worse than the historical norm.
By 2011 Lotus had improved to 104.9% of championship pace and 102.5% of midfield pace. After just one season they had become roughly equivalent to the statistical average for every last placed team since 1995. In 2012, rebranded as Caterham, they had reached 103.3% of champion pace and 102.1% of midfield pace. In three seasons they had become a team that could be charitably described as a "real" F1 team.
| Season | Gap to Champion | Gap to Midfield | 107% Rate |
|---|---|---|---|
| 2010 Lotus Racing | 105.10% | 103.91% | 8% |
| 2011 Team Lotus | 104.85% | 102.57% | 3% |
| 2012 Caterham | 103.29% | 102.16% | 0% |
| Dataset average | 104.1% | 102.66% | — |
Tony Fernandes sold the team in July 2014 to a consortium of Swiss and Middle Eastern investors. The man who had counted a classified retirement as two cars finishing in Bahrain had concluded, four years later, that the economics no longer made sense. The new ownership couldn't secure the funding to complete the season, missing the United States and Brazilian Grands Prix. In a detail that sits somewhere between admirable and desperate, the team crowdfunded their way back onto the grid for the Abu Dhabi finale, raising enough from fans to put two cars on the grid one final time. In March 2015 the assets were auctioned, yet unlike so many failed teams in the modern era, no successor operation emerged. The team that four people had built from an empty factory in Norfolk, that had closed the gap to the midfield in three seasons, that had made Q2 and finished races as a credible back-marker, left nothing behind that anyone wanted to race with.
If this team had been the only new team to enter in 2010, it would probably be remembered with the likes of Minardi. A small underfunded team that turned pennies into horsepower, that ultimately couldn't keep pace and faded into the pages of history. But Lotus entered 2010 with Virgin Racing.
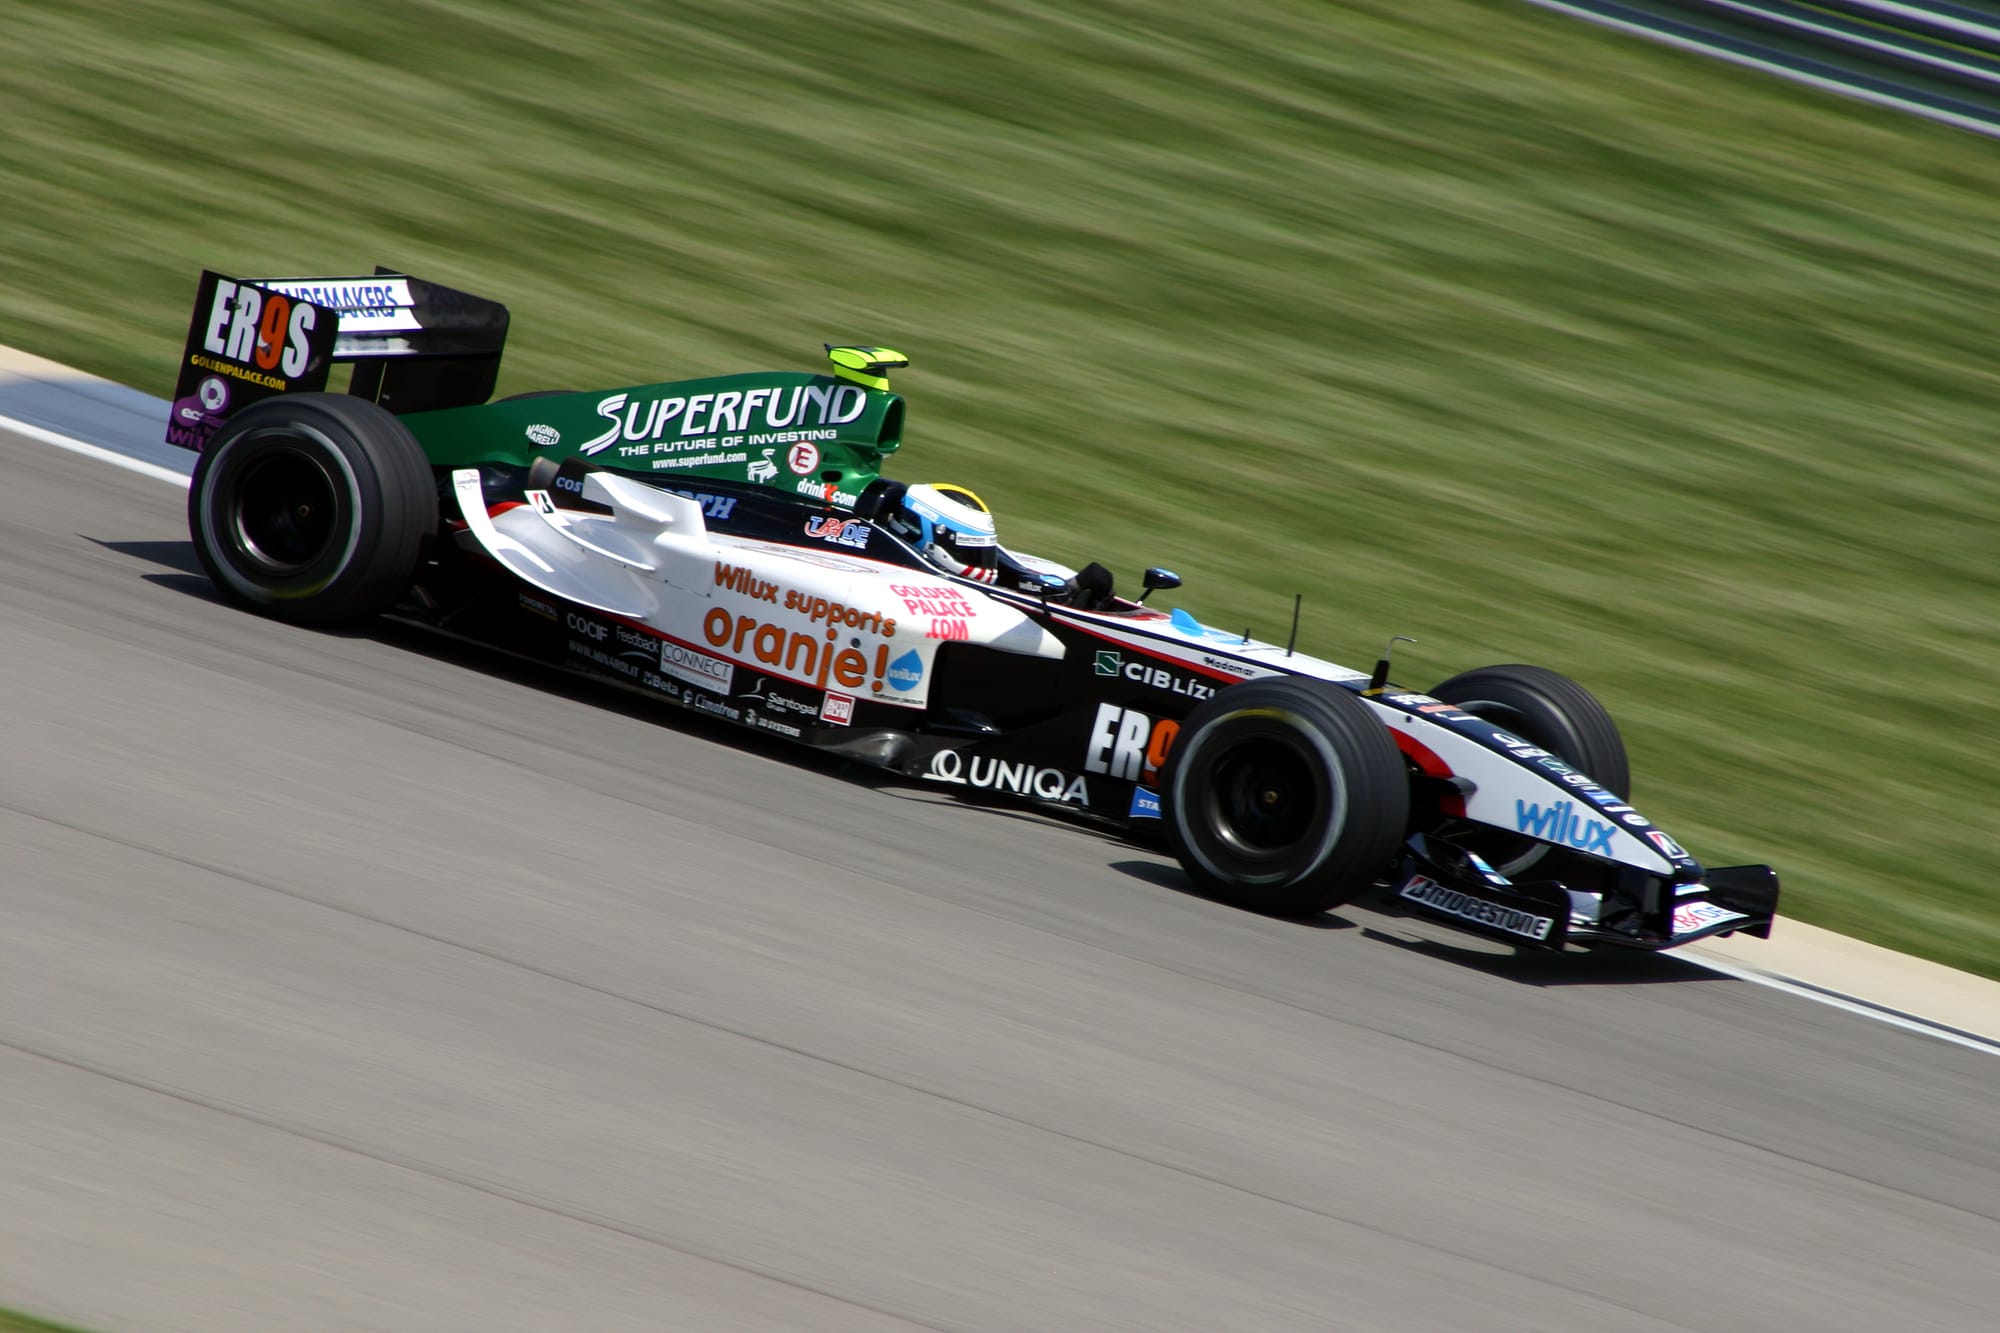
Virgin Racing
Virgin Racing arrived in Bahrain to start the season as a result of a partnership between three organizations. Manor Motorsport (the same one already mentioned in this article for their 2015 season) brought junior formula experience and race operation credibility. Billionaire Richard Branson brought the budget via his Virgin brand. Wirth Research brought Nick Wirth and his ideas about the future of aerodynamic development in the sport.
Virgin Racing took a revolutionary stance on the development of their first car. Virgin Motorsport believe that Computational Fluid Dynamics was the way of the future and as such they designed their entire car with no wind tunnel and no physical testing infrastructure. John Booth, Manor Motorsport Boss, predicted that wind tunnels would be obsolete before Lotus Racing had finished building their own. Nick Wirth believed CFD had advanced to the point where the tunnel was unnecessary. This was not a compromise, but rather a radical new approach in the sport. At the time these were considered radical ideas, but not necessarily unreasonable. However, as of 2026, wind tunnels remain a regulated and fiercely contested resource in Formula 1. Every team on the grid uses one.
The VR-01 arrived at the first race of the season unable to carry enough fuel to complete a Grand Prix at full speed. The tank was undersized for full-throttle consumption. A technical operation sophisticated enough to simulate airflow across every surface of the car had not accurately modelled how much fuel the engine would burn in race conditions. This is not a detail about bad luck or hostile circumstances; this is a first principles failure. At the most fundamental level, a racing car must be able to finish the race for which it is entered. Virgin applied to the FIA for permission to modify the chassis before the Australian Grand Prix. The fix required a longer underbody, revised engine cover, and additional bodywork changes.
Their start in Bahrain was representative of the rounds and seasons to come. Virgin Racing in 2010 posted a seasonal average of 105.6% of championship pace and 104.4% of Mid-field pace. Virgin had a larger gap to the midfield than would be expected from the typical last-placed constructor when compared to the champion. Not only were they well off the pace, but their 107% pace failure rate was 18%, representing nearly 1 in every 5 entries in 2010. This should have been a massive red flag for a team who had built their entire identity on theoretical simulations.
Entering 2011 Virgin Racing (renamed Marussia Virgin Racing) remained steadfast in their CFD only approach, in spite of the on-track results. Their 2011 season saw a 106.52% gap to the champion and a 104.2% of Mid-field pace. Where the car really fell apart was the 107% failure rate. They failed to set a lap time within 107% of the champions pace 50% of the time. In June of 2011 Virgin ended their technical partnership with Wirth Research, and with it, their CFD first approach.
| Season | Gap to Champion | Gap to Midfield | 107% Rate |
|---|---|---|---|
| 2010 Virgin Racing | 105.60% | 104.41% | 18% |
| 2011 Marussia Virgin Racing | 106.52% | 104.21% | 50% |
| 2012 Marussia | 104.67% | 103.53% | 3% |
| Dataset average | 104.1% | 102.66% | — |
For development of their 2012 car Virgin Racing (now known as Marussia Racing) partnered with Mclaren Applied Technologies. That partership, which featured a use of CFD and wind tunnel testing, saw Virgins' pace improve to 104.67% of the champions pace, and 103.5% of midfield pace. After 3 seasons, they were now almost normal bad.
In 2013 Virgin Racing became Marussia racing, and were resembling something like a respectable F1 team. Jules Bianchi even scored them their first ever points at the 2014 Monaco GP. But these highs were soon followed by lower lows; the team failed to finish the 2014 season and entered administration. They entered the 2015 season as Manor Marussia.
Virgin entered the sport with a flawed concept that ultimately yielded few positive results and a legacy that is hard to frame as anything other than historically bad. But the 2010/2011 Virgin Racing seasons are not the worst ones I found. It is not even the worst car in 2010 or 2011.
Hispania Racing Team
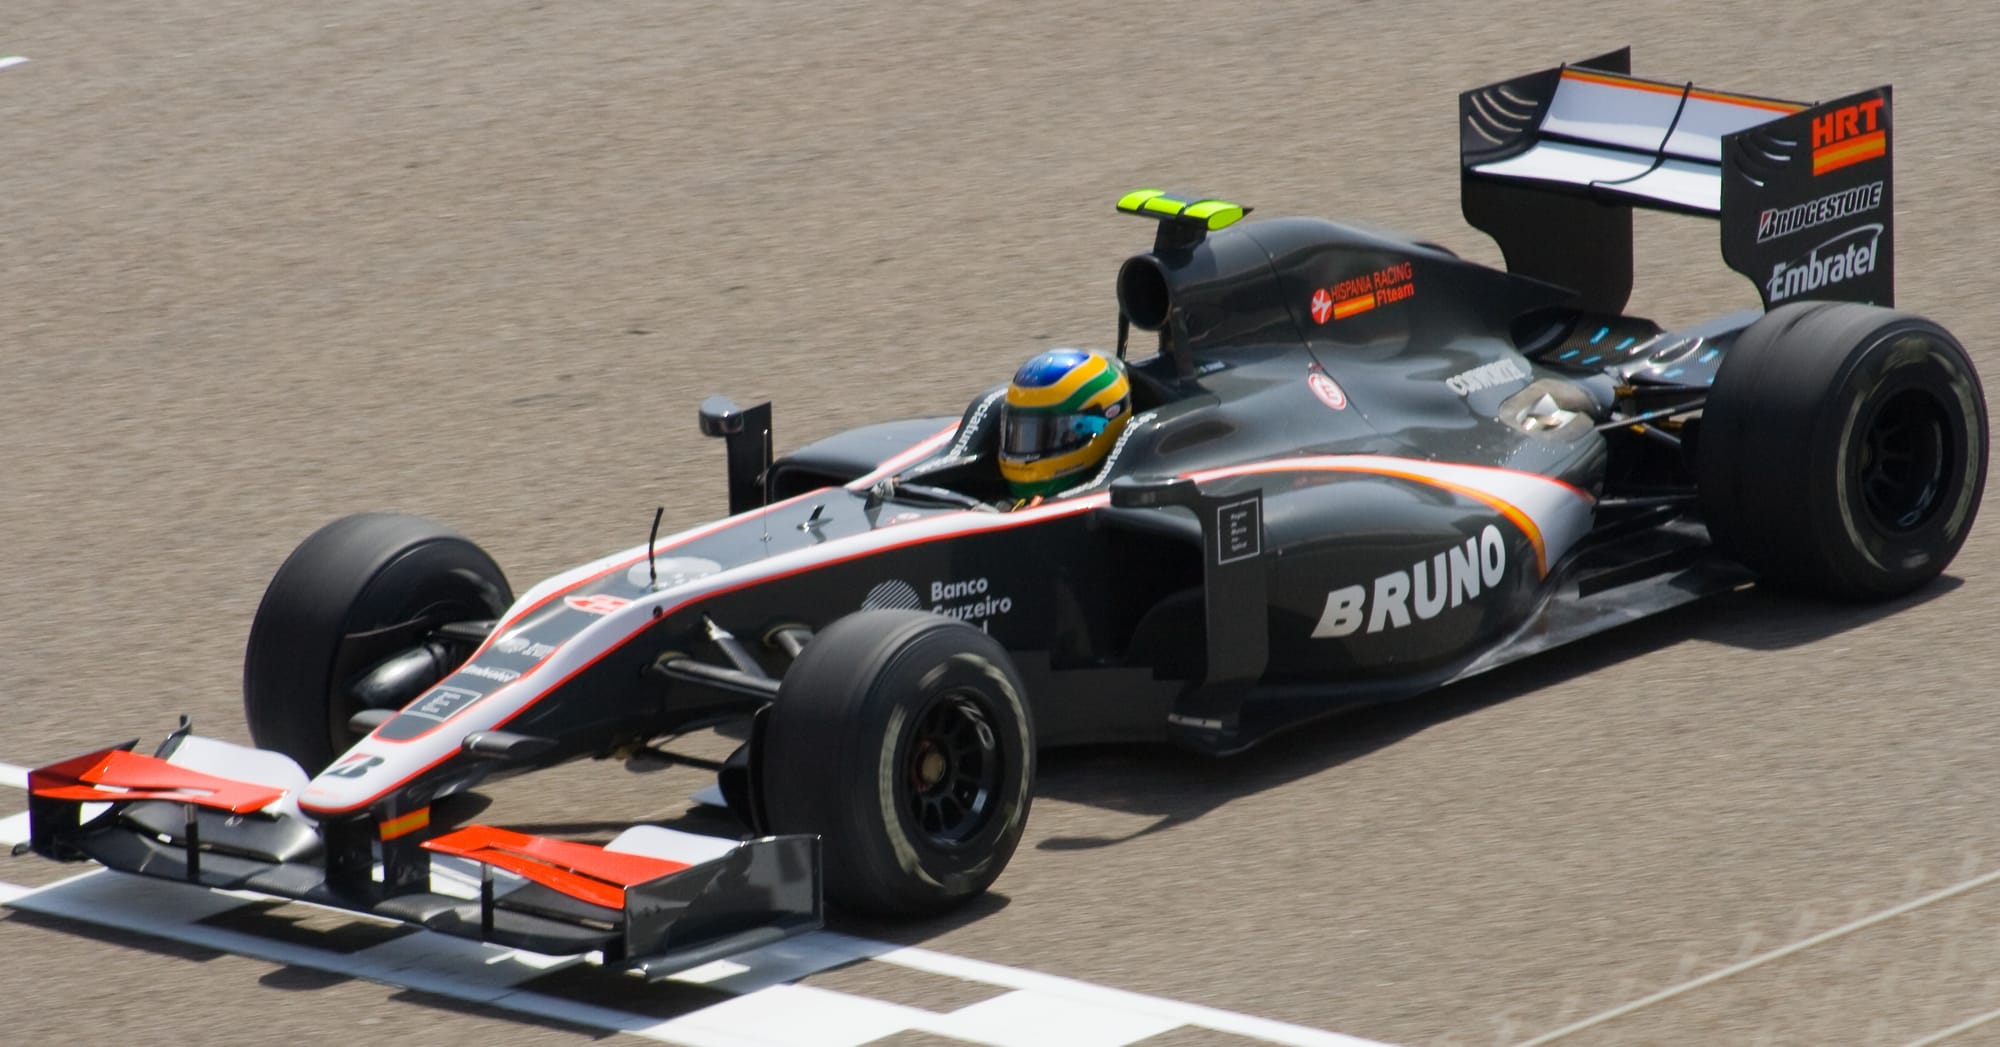
In June 2009, the FIA announced that Campos Meta had passed its stringent due diligence process covering funding, resources, experience, and technical expertise. What they had selected was a partnership between Adrián Campos, a former Formula 1 driver, and Meta Image, a Madrid-based sports agency. Campos Racing had genuine motorsport infrastructure; in 2008 they had won the GP2 team championship. They had a deal with Dallara to design and build the car, and they had a site in the Region of Murcia for a new technical facility. On paper, of the three new teams selected, Campos Meta had the most conventional path to the grid.
By December 2009, just over 3 months from the first race of the 2010 season, Bernie Ecclestone had begun to voice his concerns over the team’s ability to make the grid for the first race of the season. If those early warnings that something was wrong in Spain were ignored, it became even harder to ignore the signs in February when Campos himself said "sometime we have the money sometime we don't" when asked about his technical partnership with Dallara. Fourteen days later Adrian Campos was removed from his own team and was replaced as team principal with Colin Kolles. The team was renamed Hispania Racing Team, HRT. The Dallara built car had been delivered to the factory, but that was all. The team missed the entirety of preseason testing, and it remains unclear if they had even put wheels on the car much less turn them.
With three weeks before the first race in Bahrain, many had assumed HRT would not make the grid. But HRT proved the doubters wrong; they got to Bahrain and Bruno Senna ran three installation laps before the wheels literally fell off. The other car, driven by Karun Chandhok, never left the garage. The clutch and gearbox didn't work. But that afternoon in FP2, things were looking up. Bruno Senna had his wheels put on and they were running laps. Their best time in the session was 2:06.968. Nico Rosberg was lapping over 11.5 seconds faster, and in the GP2 feature race (yes GP2), Luca Filippi set a time of 2:07.087 to qualify P1. HRT had managed to do what only Fernando Alonso understands, they had entered a GP2 car in Formula 1. But their story changed during qualifying, and HRT managed to show that their pace was at least faster than GP2 when Bruno Senna set a blistering 2:03.240, for reference both Virgin and Lotus managed to get a car around in less than 2 minutes. At this point, in their first ever race weekend, they had spent Friday broken down or running slower than GP2. They had improved on Saturday, both cars managed to get on track, and at least looked faster than a GP2 car. But then came Sunday, and both cars started from the pits. Karun Chandhok ran 1 lap before his front wing was damaged and he was forced to retire from the race. Bruno Senna made it 17 laps before his car overheated and he was forced to retire the car. The total race distance was 49 laps of the Bahrain Endurance Circuit. As a team, HRT managed 18.
The HRT F110 had a rough start to the 2010 season, but the Campos/Dallara payment dispute had frozen the car at its launch specification. The only modification that was made across the entire 2010 season was moving the mirrors inboard to comply with a regulation change. HRT entered a car that was closer to GP2 than F1, and then did nothing to improve it.
| Season | Gap to Champion | Gap to Midfield | 107% Rate |
|---|---|---|---|
| 2010 HRT | 107.09% | 106.39% | 63% |
| 2011 HRT | 107.35% | 105.09% | 68% |
| 2012 HRT | 105.68% | 104.52% | 15% |
| Dataset average | 104.1% | 102.66% | — |
I'm going to take a short break from the HRT story here. It has taken me a few weeks to gather the data for this article, and research the stories of these teams. I waited to write the story of HRT last, because I just couldn't wrap my head around the numbers I am about to share. The more I read about this team, the less things made sense. In 2010, HRT posted a seasonal average of 107.09% of championship pace, and 106.39% of midfield pace. They failed to qualify at 107% pace 63% of the time. That means roughly 2 out of every 3 entries. The season ran for 19 rounds, and HRT managed to get both cars past that threshold 5 times. In 14 rounds, 1 or both of their cars failed to set a time equal or better than 107% of P1. I have been writing about bad F1 teams for a few weeks, and this is the only team that feels like the entire structure of the sport failed.
We return to the story in the summer of 2010; HRT has agreed to a deal with Toyota Motorsport GmbH to use the never-raced TF110 as the basis for their 2011 car. With Toyota's full technical resources, it looked like HRT had managed to find a foundation to build on. In November 2010, Toyota cancelled the agreement because HRT had failed to make the payments.
The 2011 season, built without that foundation, produced 107.35% of championship pace, worse than 2010. Their 107% qualifying rate? That also rose to 68%. In 2012 their car failed mandatory crash tests before the season, both drivers were excluded from the Australian Grand Prix for failing the FIA-107% threshold, and in November, the team missed the deadline to pay their 2013 entry fees. No buyer was found and the assets were sold to a firm specializing in recycling automotive parts, who intended to race the cars in the EuroBOSS Series.
The FIA's due diligence process had certified HRT as viable in June 2009. Ten months later the team that replaced it couldn't afford to develop its car. Seventeen months later, it couldn't afford a deal it had already signed. Forty-one months later,its cars were headed to a regional "racing series". After three years on the Formula 1 grid, the most sophisticated destination anyone found for what they had built was a recycling company.
The Final Verdict
Bad teams in Formula 1 are nothing new. The heart and soul of Formula 1 was built on the backs of teams who could only afford to bring a car and some ham sandwiches. On paper these teams knew that they could not compete at the front, but they showed up anyway, and on occasion they produced something remarkable. Pacific Ford showed up with an outdated car, a team of 30, and qualified for races. Minardi made magic for 20 years, and their drivers lineup includes some of the greats of our time: Fittipaldi, Fisichella, Webber, Alonso. The privateer era produced teams that knew exactly what they were and competed within those limits until the sports economics could no longer support them.
Unfortunately, that era has gone, and with it a friendlier definition of what a Formula 1 team should be. What our data shows is not just the gap between the back-marker and the champion, but also, the gap between the back-marker and what a team should reasonably be. That gap, tells a story about what it means to be in F1. A team can score zero points and be doing everything right. A team can score zero points and be doing everything wrong.
The team’s in this analysis, and particularly those born in 2010, represent some of the slowest, least capable cars ever fielded in the sport's history. Some of them got there because they just ran out of cash, some through a fundamentally misguided engineering philosophy, and still others collapsed before they even made the grid.
Half of the Modern F1 grid can trace their origin back to a team that showed up in this analysis. Toro Rosso/Alpha Tauri/RB/Racing Bulls were built on the foundation made by Minardi. Aston Martin traces back to Jordan, and the most dominant team in the sport, Mercedes, traces back to Tyrrell.
That is the honest verdict that our data produces. Not that these teams were the slowest, but that they were slow in ways that reflected something structural and permanent. An absence of institutional knowledge, technical foundation, or organizational coherence that no amount of time on the grid was going to correct. The sport has always made room for teams that are slow. It has no room for teams that cannot learn.
Also, the worst team is HRT.